
Questions and answers
If you encounter any problems, please read the below FAQ for quick problem solving. If you can’t find the answers you need please contact support at support@beescanning.com with a short description of your issue and your Client-ID. The ID is located at the top of the apps main menu.
IS THE APP FOR FREE?
It is free to download and try out for two weeks. If you want to continue you can pay for a monthly or yearly subscription. Recurring billing, cancel or switch anytime.
PERFORM YOUR FIRST BEESCAN
Start the app, create an apiary and a hive and press “Analyze”. Photograph your bees on the comb. Don’t photograph the entire comb with just one picture – instead on a big frame like Dadant take 4 pictures for each side, 8 in total, depending on comb frame size. Use a support for the frame. We recommend the BeeStand, https://www.beescanning.com/beestand/.Hold your camera steady and focused at around 8 inches or 21 cm from the bees.
Press “Done” top right and then “Analyze”. The app will upload the images. Once the AI is ready it returns your result. If you have weak connection, just upload the photos when you get a better signal.
Here is a short video on how to add a hive take pictures and analyze.
HOW DOES THE APP FIND HIDDEN MITES?
The game changer with our patented technology is the way the AI manages to calculate for hidden mites and present actual infestation level results even though there are mites hiding under the bees. We have trained the AI annotating tens of thousands of images with varroa. In our extensive field tests we compared how many mites are visible to the hidden ones. We did this by analyzing 1000 colonies with BeeScanning and then analyzing the same colonies with alcohol wash. We found that there is a correlating factor and we use that inside the app to present the actual infestation.
WHAT ABOUT THE SILHOUETTE BEE?
The silhouette bee helps with optimal photo distance. Move your camera to sync the silhouette with the size of the actual bees to optimize your picture for analyzing. A distance between phone and bees of approximately 20-25 cm or 7.8 to 9.8 inches ensures good image quality.
HOW MANY IMAGES SHOULD I TAKE PER HIVE?
– You want to include about 4000 bees per analyze. That often equals more than 10% of the population.
– This usually means bees from 3-4 brood frames per hive.
– Take 2-4 images on each side of the brood frames, 6-8 in total.
– You need about 15 images (if few bees, take more pictures) per analysis.
HOW SHOULD I TAKE THE PICTURES
The better the quality of your pictures, the better our AI performs. Here are a few guidelines to ensure good image and analysis quality:
– The images needs to be sharp.
– Avoid overlapping images.
– Try to avoid side light as it creates shadows and contrasts.
– Take the picture from about 20-25 cm or 7.8-9.8 inches from the frame.
– Take images (from the correct distance) where there are many bees (15 images * 250 bees/image = 3 750 bees).
HOW DO THE APP COUNT VARROA INFESTATION LEVELS?
Varroa infestation is the number of mites divided by the number of bees. In a sample with 3 mites on 300 bees that would equal 3/300 = 0,01 = 1%. That is the number of phoretic mites, (mites on bees, not in the brood) detected in the images in relation to the number of bees. The infestation level is then multiplied with a factor. This factor derives from extensive field tests and comparative studies between the BeeScanning method and alcohol wash and reflects the ratio between observable and actual number of varroa mites.
WHAT IS BROOD DISORDER – “bd” IN THE ANALYSIS RESULT?
While scanning for varroa we also analyze the brood and any signs of disorders. Our AI has been trained on American and European foul brood, sac brood, chalk brood and cell lids with abnormal openings. Our concept of “bd” means both the illnesses mentioned above caused by bacteria, fungus and viruses but also any visual abnormal cell capping. This may be due to bees decapping cells where varroa is detected or dead brood caused by chill.
Whatever the reason for bd it should be noticed as a strong sign that calls upon urgent examination to clarify the cause. We have found that our AI reports at a level that makes it very reliable finding disorders even though it may indicate the finding with confidence as low as 10%. We have decided to show the user even low confidence objects and let our users decide how to interpret and act.
WHERE ARE THE ANALYZED IMAGES STORED?
Images are stored on our servers and/or in the cloud.
WHO OWNS THE IMAGES?
You. We own the rights to use them according to your agreement in Terms of Service.
WHAT IF I LOSE MY PHONE?
Your images may be recovered from the server. And will show up once you log in to your account.
You. We own the rights to use them according to your agreement in Terms of Service.
WHAT IF I LOSE MY PHONE?
Your images may be recovered from the server. And will show up once you log in to your account.
WHAT IS THE ACCURACY OF THE IMAGE DETECTION OF VARROA?
In our environment the so called recall is about 80%. That means the software finds 8 out of 10 varroa that are optically visble. We consider that enough for practical purposes, warning the beekeeper in time. The NN can find the mite even if only parts of it are visible or if its under a wing but results may be affected due to optical circumstances. We will keep learning how to integrate uncertain detections of difficult objects. Analysing video sequences will add to the accuracy and our knowledge on how the parasite and the host coexist.
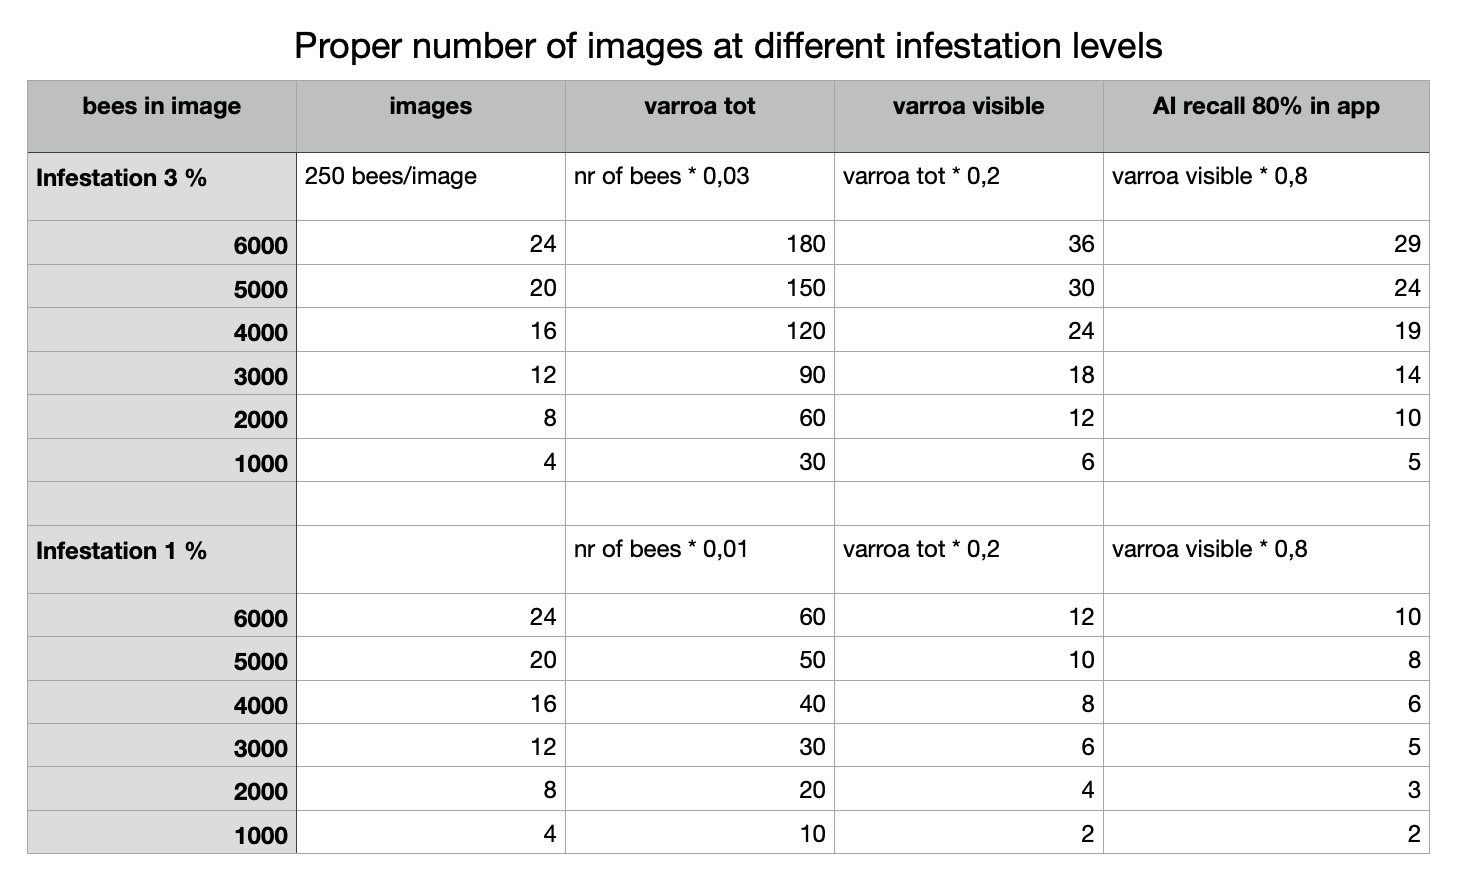
In the table bottom row at infestation level 1% you may see that with only 4 images the AI will still pickup 2 varroa and calculates the infestation.
IS THE APP RELIABLE?
On launch we know that in our environment, the software finds the Varroa mites with great accuracy. The more images we can collect from you using the app the better it will become. The neural network (NN) will learn from its errors and improve. Look at it as you are part of a great pioneering mission. Disclaimer: Results are based on our field studies and may depend on our location, methods of manual analyses, breed of bees, etc. We have conducted field studies since 2016 collecting images comparing to results from alcohol washing from the same frames images were taken. Have in mind that any result of low infestation is not a guarantee you don’t need to treat. Depending on your individual conditions; as what type of bees, time in season, reinvasion from neighbors, quality and the number of images at hand it may influence the interpretation of the result. On the other hand if a high infestation is recorded that is of course a strong signal to be taken seriously.
WHAT IS THE ACCURACY OF IMAGE ANALYZING COUNTING BEES?
In our environment the software performance is about +/- 5 %. That is how accurate the NN reports compared to the known test data. Counting number of bees is done by a totally different NN-technology compared with the mite detection.
In our environment the software performance is about +/- 5 %. That is how accurate the NN reports compared to the known test data. Counting number of bees is done by a totally different NN-technology compared with the mite detection.
TESTING THE ACCURACY
The most important factor for a reliable result is image quality. Distance, sharpness, lighting conditions etc. If you provide the image ID, we can check the conditions in our media tool and suggest help to adress any issues.
THE GLOBAL VARROA HEATMAP
The apps varroa map shows the latest results of performed analyzes within the app. To protect our users’ locations, the ability to zoom in has been limited.
The apps varroa map shows the latest results of performed analyzes within the app. To protect our users’ locations, the ability to zoom in has been limited.